Published: Sep-2024 | Category: Data Loggers
NOTE: We have now updated the Vu+ with the newer Vu Pro, however the content in this article still applies.
The 2014 UK primary science curriculum focuses on developing scientific knowledge, understanding, and skills among students through a range of topics and activities.
Integrating data logging activities into the primary science curriculum is an excellent way to enhance students’ understanding of scientific concepts through hands-on experience.
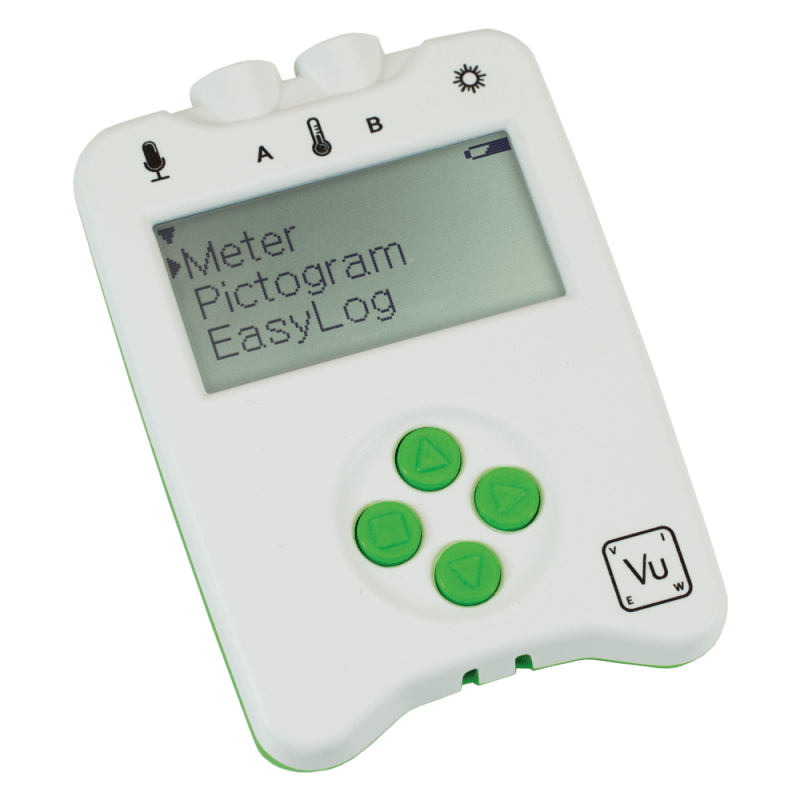
The Vu Pro or Vu+ data loggers are versatile tools that can be used across different key stages and topics. Read our key stages guide that outlines how you can incorporate data logging activities into various topics within the key stages, along with examples of sensors that can be used.
The following activities and their alignment with the Key Stages aim to gradually build scientific knowledge and skills, ensuring that students develop a strong foundation in science and are prepared for further learning in KS3 and beyond.
Working scientifically
Use the Stopwatch and Counting capabilities of Vu Pro or Vu+ to help students understand the importance of simple measurements, and how we count and measure in numbers and pictograms.
Animals including humans
Exercise is brought to life with the Heart Rate and
Temperature Sensors. The Push Button Switches and Timing Mats further expand how our bodies respond to different exercise demands.
Everyday Materials
Use the Temperature Sensor(s) to compare the temperatures of various materials. See how quickly things cool and heat when exposed to heat or sunlight.
Living things and their habitat
Employ the Vu Pro or Vu+ Counting facility to help show how plants are distributed. Work collaboratively to gather and compare data.
Seasonal changes
Use the Light and Temperature Sensors (along with stored data) to show changes throughout the year. Show how the length of a day changes as the seasons pass.
Discover how light and temperature alter with different weather conditions.
The Light Sensor can be used to show how the Sun’s light can be safety reduced (and why you should never directly look at the Sun).
Working scientifically
Let Vu Pro or Vu+ help show how data should be gathered and the importance of the correct usage of scientific units. Using Review, export the data for graphs and tables presentation and compare the findings with other workers appreciation of a “fair test.”
Plants
The Light and Temperature Sensors may be used “in the field”(with the Vu Pro or Vu+ Review option) or back at base (EasySense) to show how these variables can influence plant growth. Data Harvest’s wireless Soil Moisture Sensor* to greatly enhance plant-based studies.
Light
The Light Sensor can be used to show that dark is the absence of light. With a mirror and a low-power torch, show how light is reflected from surfaces. Use light filters to illustrate how we can be protected from the Sun’s harmful rays (and to never look directly at the Sun).
Forces and magnets
Vu Pro or Vu+ Light Sensor can be set to use with a “test car” moving across different surfaces. Show, with the Timing Ramp Set, how a magnet has two poles, what is magnetic and how magnetism acts at a distance.
Living things and their habitat
The Vu Pro or Vu+ Counting facility can be used to help show how plants are distributed throughout the year. A habitat can be monitored by using the Light and Temperature probes to add additional information. Vu+ can be used together to count and analyse for quadrant analysis.
States of matter
Light and Temperature Sensors together, or independently, can show how materials change state when they are heated and cooled. Examine the rate of evaporation using the Temperature Sensor and a set of controlled water samples.
Sound
With the Sound Sensor, show how sounds are made. Answer why sounds get fainter with distance, and how the medium it travels in affects how we perceive it. Use EasySense to explore how the sound level is affected by the strength of vibration or impact, using a tuning fork at different distances from Vu Pro or Vu+.
Electricity
The Voltage Sensor connected to Vu Pro or Vu+ will help understand how a simple series circuit works, what a switch does and what will affect if a lamp works or not. Show how conductors affect a simple circuit by looking at the voltage changes.
Working scientifically
Show how scientific data can be recorded in diverse ways, and how sampling can affect the outcome (Easylog, Snapshot, Counting).
Properties and changes of materials: Use the Timing Ramp Set to help group magnetic materials together.
The Temperature Sensor can be employed to watch a basic reaction; what makes the heat? what stops the reaction from reversing?
Use the Stopwatch to check the reaction and show how qualitative judgements can lead to errors!
The Light Sensor can be deployed to show that not all materials dissolve into solution and that dissolving, mixing and changes of state are reversible.
The Temperature Sensor can be made use of in evaluation of how everyday materials may be used - depending on their insulating properties.
Data Harvest’s wireless pH Sensor* can be used additionally to greatly enhance understanding of reactions.
Forces
The Timing Ramp Set or Light Gates can show the effect of gravity and “diluted gravity”. Demonstrate the principles of levers by measuring the reaction speeds at the end of the lever with different loads and fulcrum positions.
Animals including humans
Explore the circulatory system with the Pulse Sensor. Expand on the role of exercise with Pulse Sensor and Temperature Probes. Examine basic physiology with the Push Button Switches and Timing Mats.
Light
A simple pair of slits, light source, and the Light Sensor can show that light travels in straight lines. Use a simple grid (at two distances) to measure light “in and out” of the shadow; translate that to the shape of the object producing it and why light appears to travel in straight lines. Use coloured filters to help understand a spectrum.
Electricity
Use the Voltage Sensor to show how the brightness of a lamp depends on the voltage of the cells used in a circuit. Use the Voltage Sensor to show how components affect the lamp’s brightness.
By integrating the Vu Pro or Vu+ data logger into these activities, students can develop a deeper understanding of scientific principles, enhance their analytical skills, and gain experience with technology that they will continue to use in more advanced studies.
* Wireless Sensors are not part of the plug-in Vu sensor range, however they can still be used for primary science as they seamlessly integrate with the EasySense Software
It looks we have not yet posted anymore articles for this category.